
To assess the quality of my track shoe assemblies, understanding advanced QC data is critical. Detailed heat treatment curves 1, hardness distribution maps 2, and metallographic photos 3 provide insights into material properties essential for durability.
Advanced QC data, like heat treatment curves showing temperature versus time, reveal the processing steps that ensure toughness and wear resistance. Hardness distribution maps across the track shoe help identify zones with optimal hardness critical for performance. Metallographic photos, revealing the grain structure, confirm the quality of the steel and heat treatment.
Having this kind of advanced QC data allows me to make informed decisions about the quality and reliability of track shoe assemblies, ensuring they meet my operational demands and technical specifications.
What Does a Metallographic Photo Tell Me About Steel Quality?
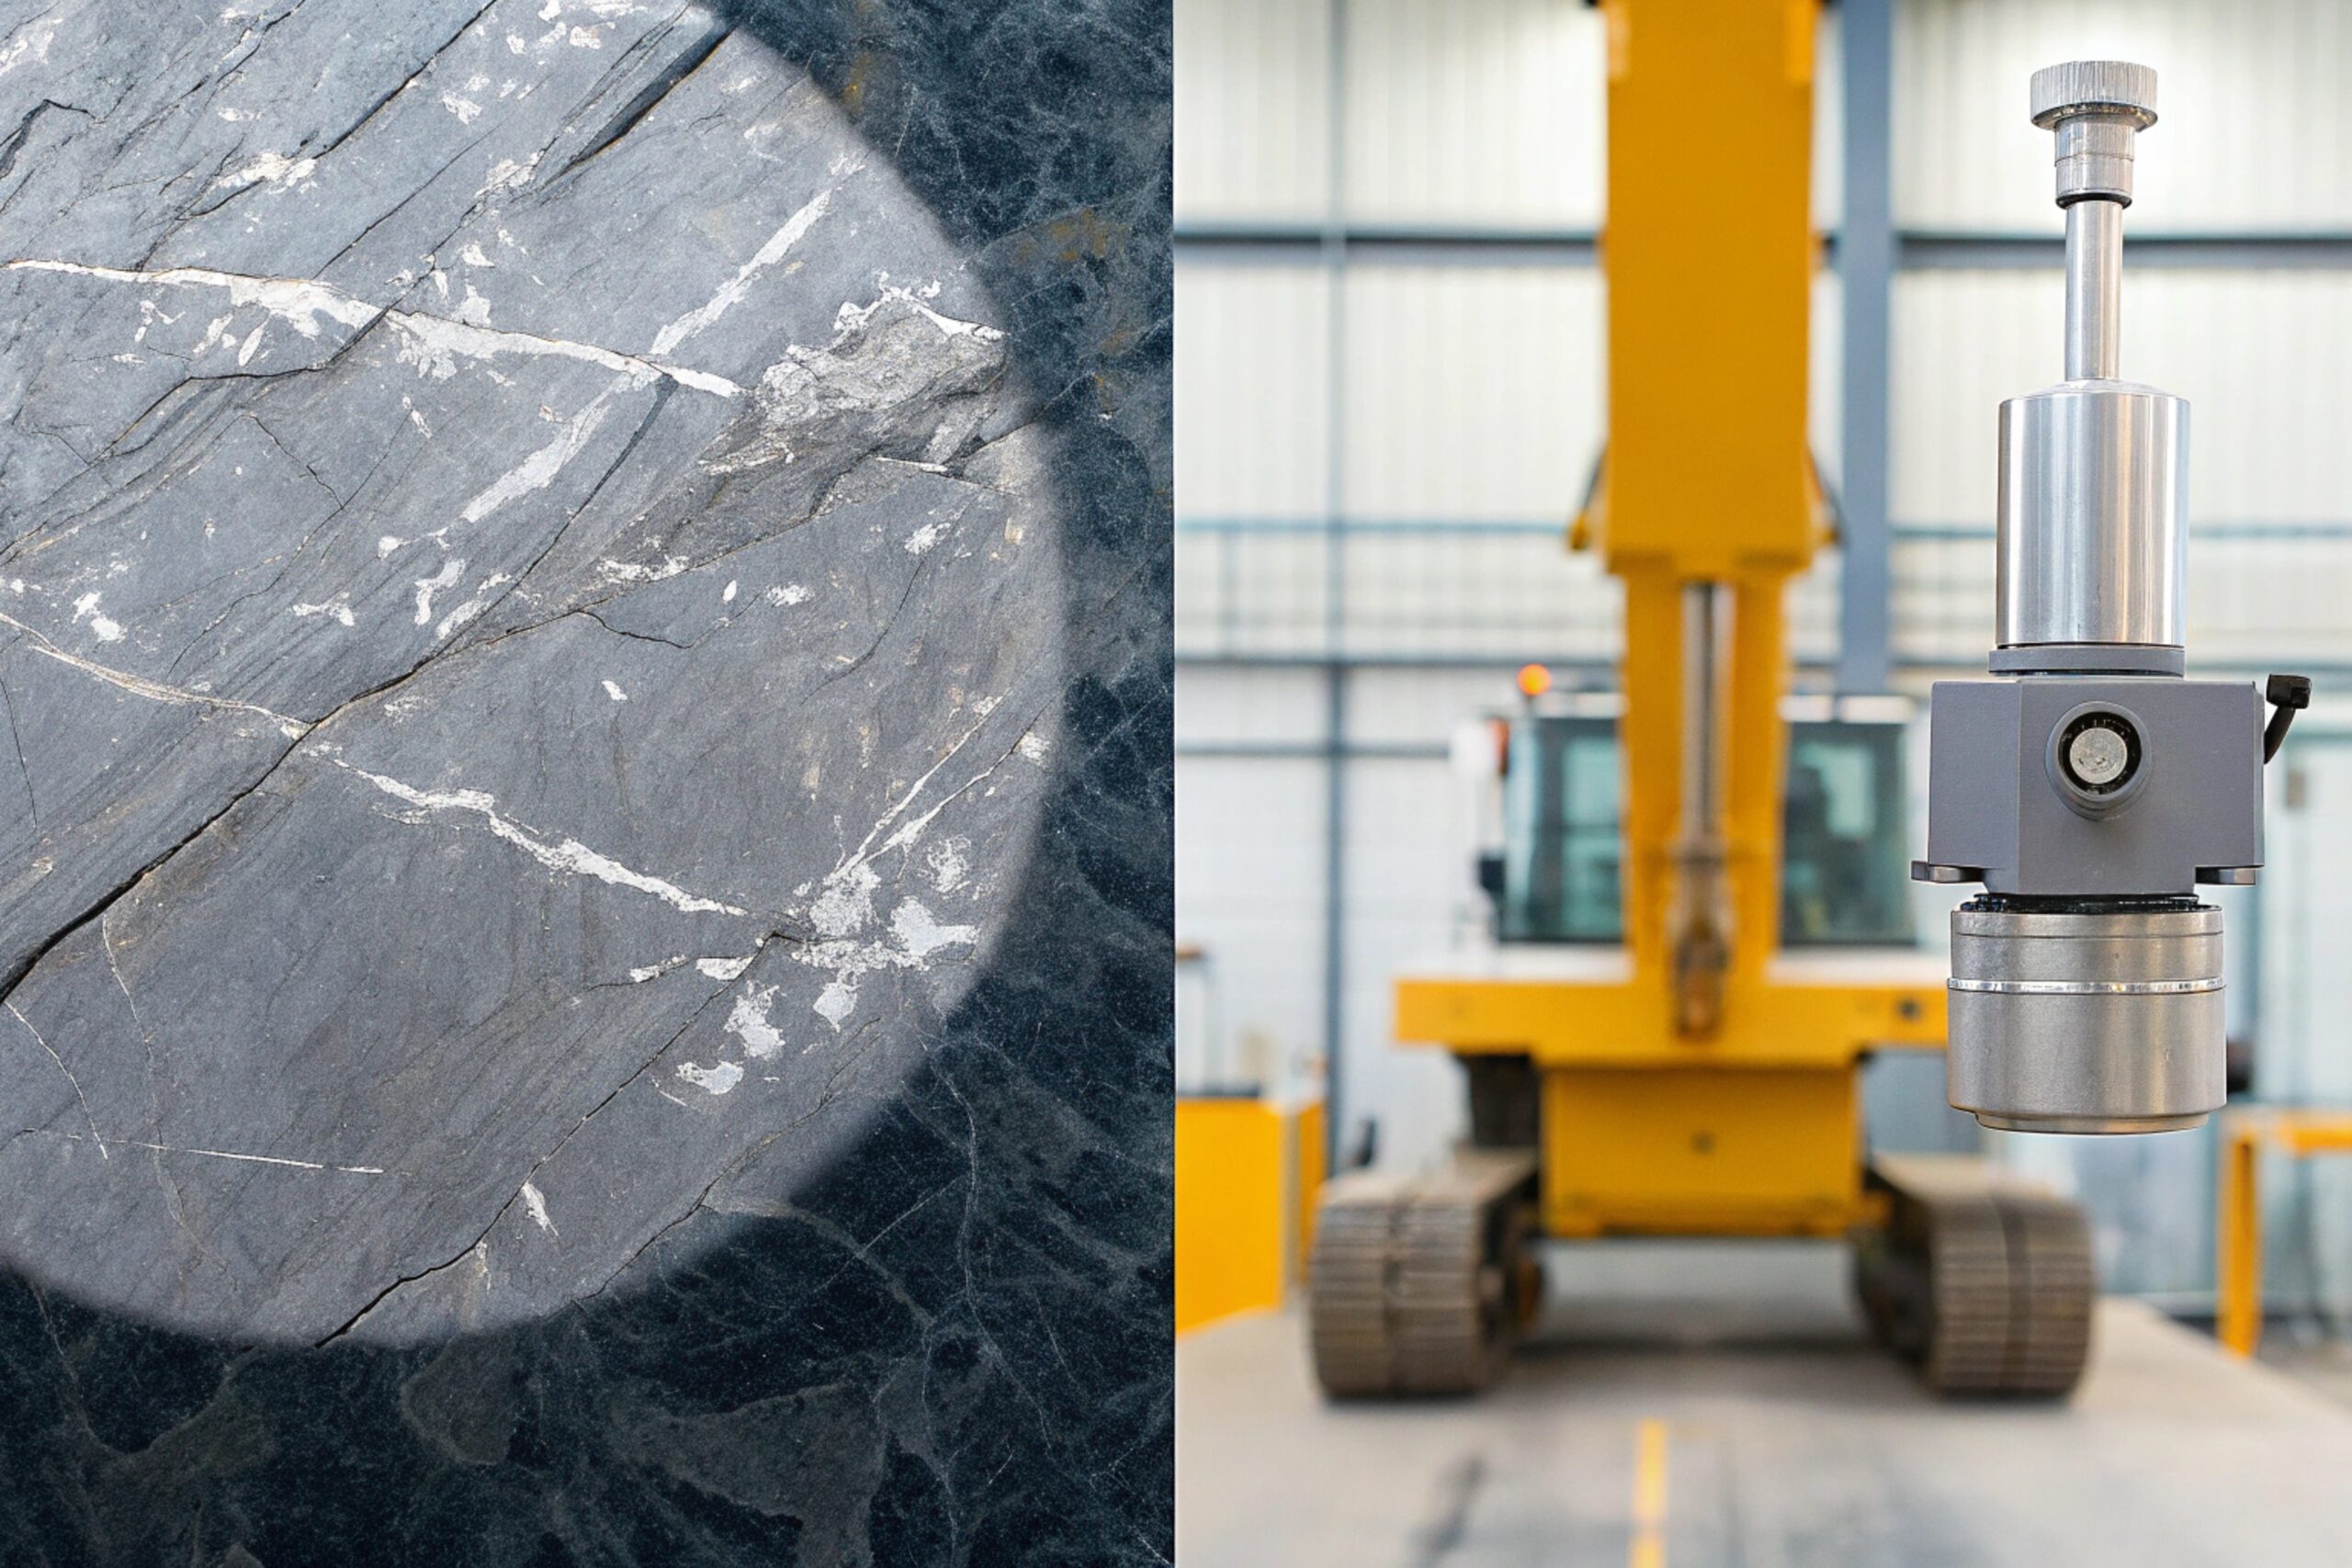
Metallographic photos can reveal vital details about the steel used in track shoes. They provide a microscopic view of the grain structure 4, which is instrumental in understanding the effects of heat treatment on steel quality.
Metallographic photos, showing the grain structure of steel, are crucial for assessing the effectiveness of heat treatment. These detailed images help identify phases like martensite, which indicate proper treatment for toughness. They're vital for ensuring that the track shoe's material properties optimize durability.
Examining a metallographic photo is essential in the QC process. They show how the microscopic structure relates to steel performance. For example, identifying finely dispersed carbides and martensite in heat-treatable steel 5 indicates that the material has gone through successful quenching and tempering. This helps ensure that track shoes can endure demanding operational conditions. Photos showing evenly distributed grains without excessive carbide networks are markers of good quality. Large, uneven grains, however, could signal inadequate processing, leading to potential failures in toughness or wear resistance.
How Is a "Hardness Distribution Map" More Useful Than a Single HRC Reading?
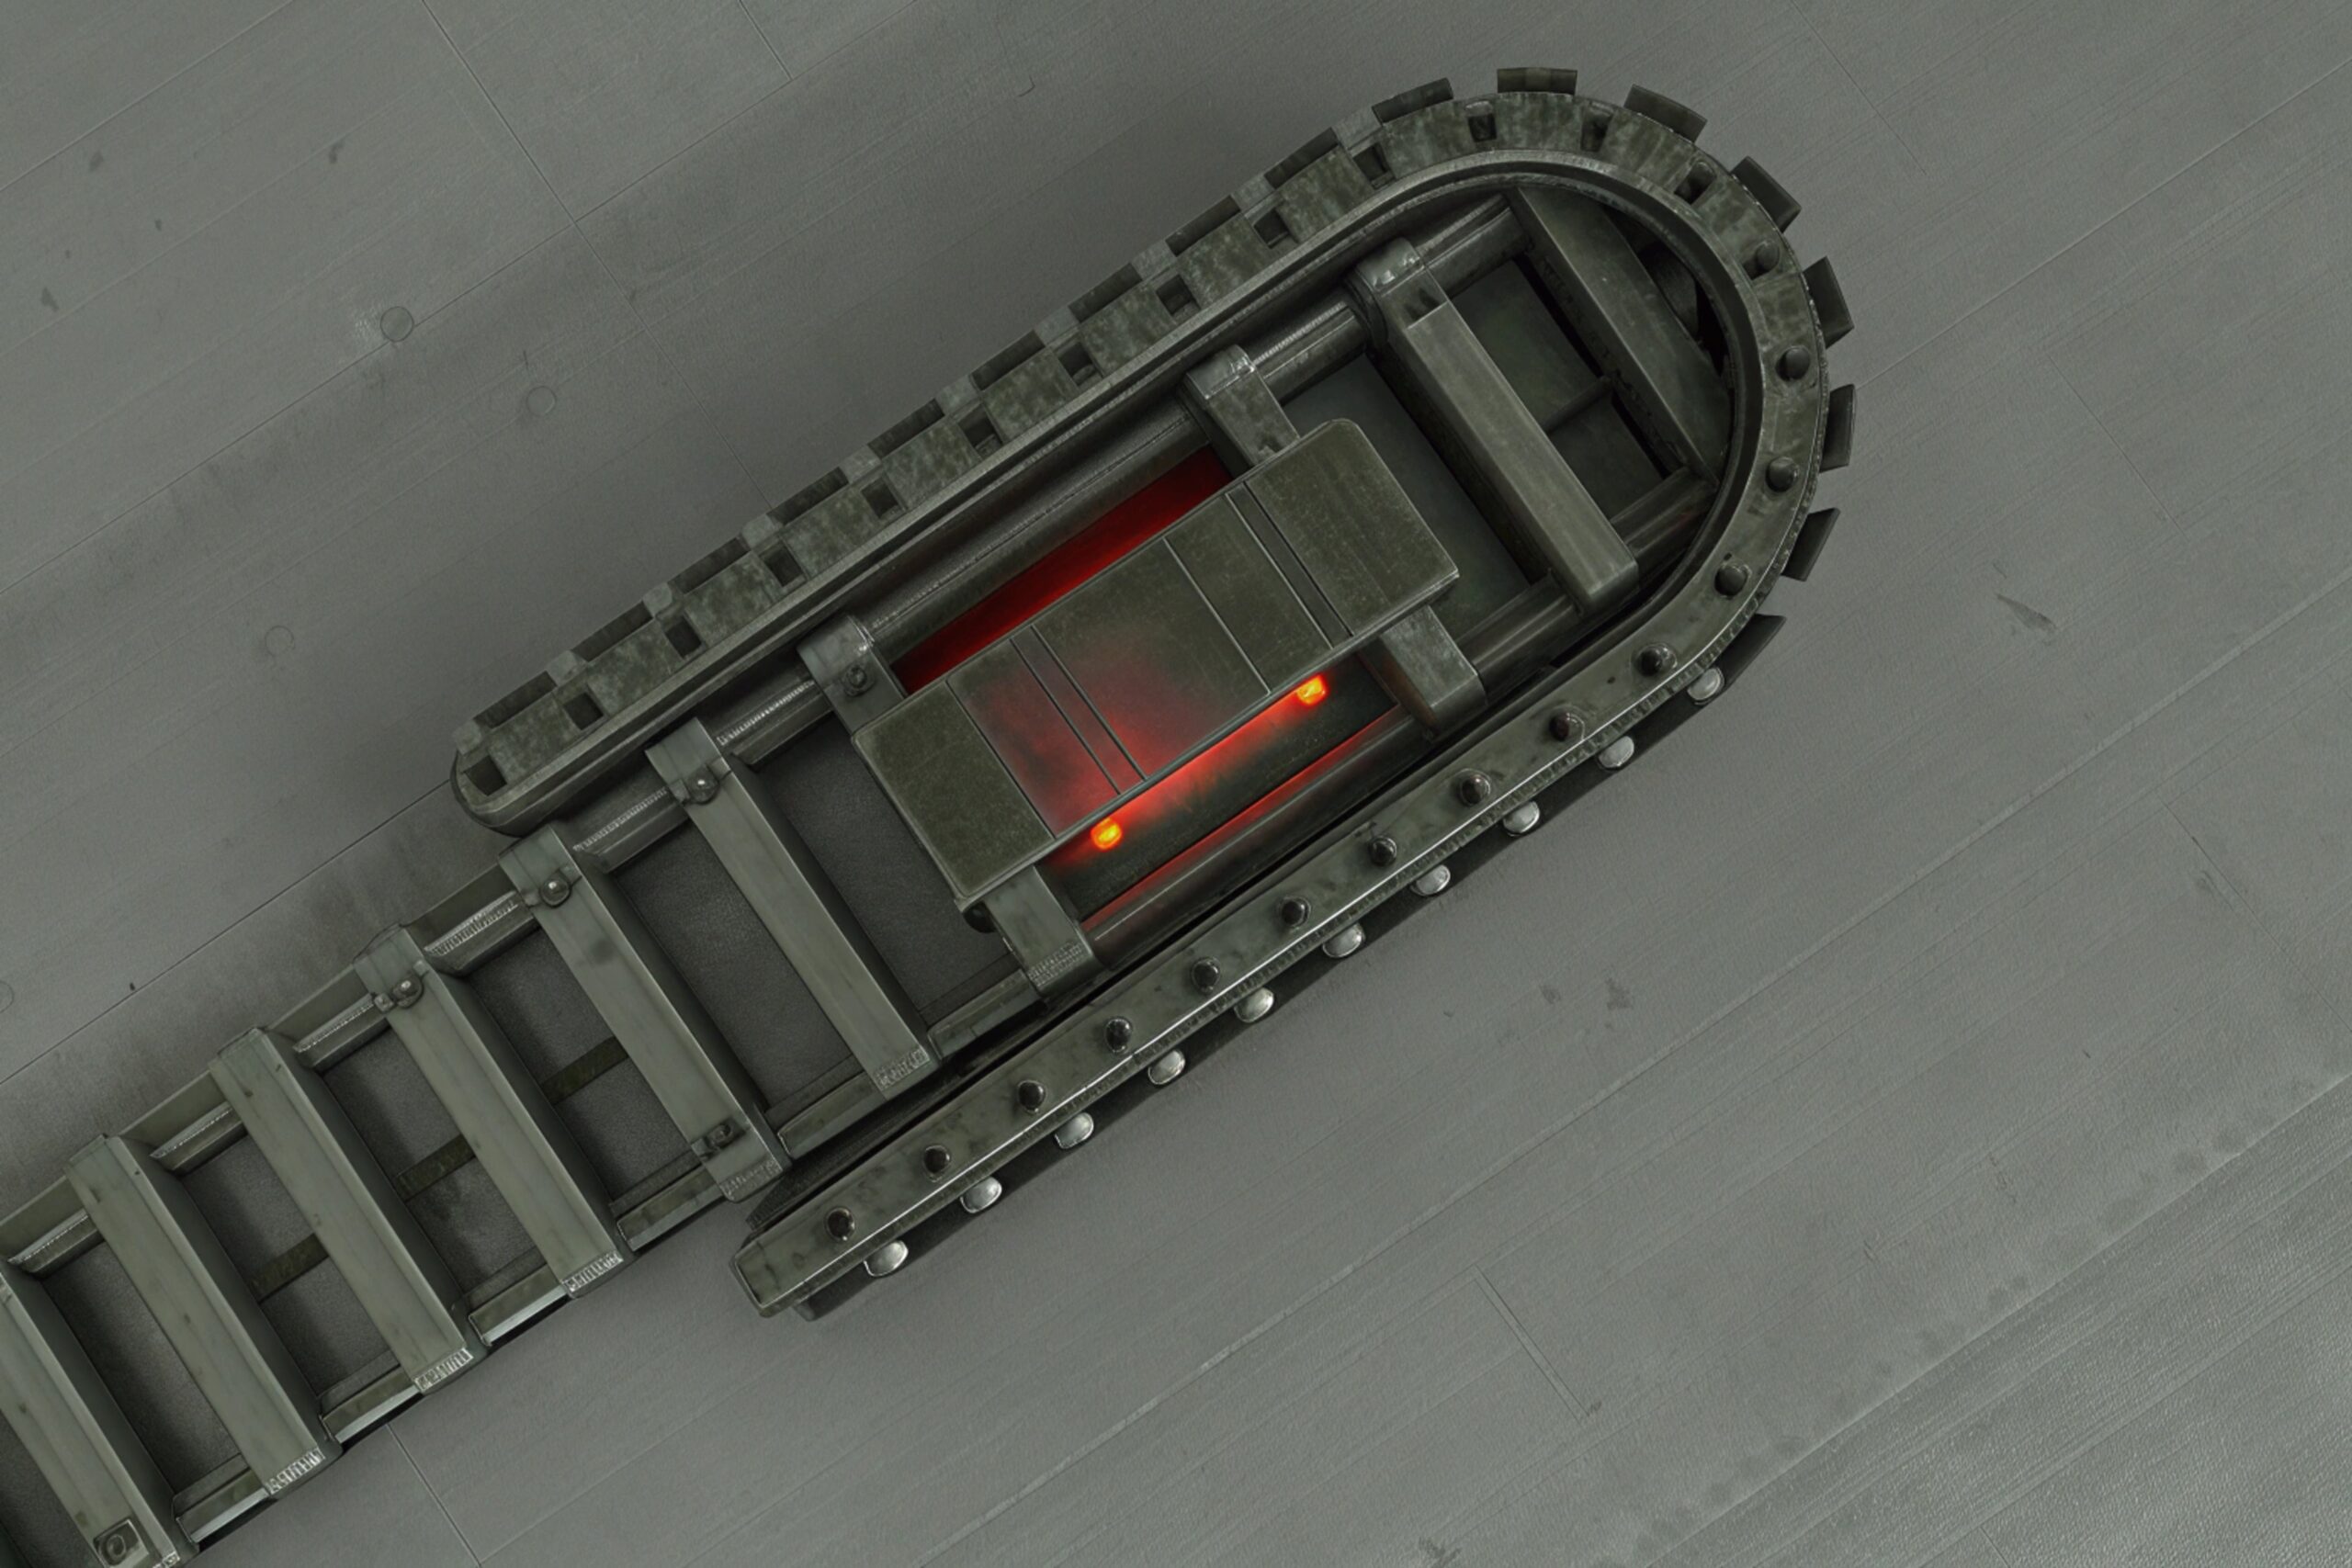
Hardness distribution maps 6 are key in understanding the wear resistance of track shoes. Unlike a single HRC reading, these maps illustrate varying hardness across different zones.
Hardness distribution maps offer a comprehensive view of track shoe properties. They reveal variations in hardness across the track shoe surface, ensuring balanced wear resistance. This data is superior to single-point hardness readings, providing detailed insights into areas prone to wear.
The value of hardness distribution maps lies in their detailed representation of how hardness varies across specific areas of the track shoe assembly. For instance, while a single HRC reading might indicate acceptable hardness, it cannot reveal variations across the surface. A hardness map provides this detail. Variations might affect wear resistance, where central areas might require different hardness levels from outer zones for optimal performance. This zonal hardness information is crucial to preventing localized failures and ensuring that all parts of the shoe assembly can withstand operational stresses effectively.
| Material Type | Surface Hardness | Core Hardness |
|---|---|---|
| High Manganese Steel | 52 - 56 HRC | 40 - 45 HRC |
| Alloy Steel | 46 - 52 HRC | 32 - 43 HRC |
| Titanium Alloy | 50 - 55 HRC | 35 - 40 HRC |
Why Is Seeing the Heat Treatment Curve Important for Quality Verification?
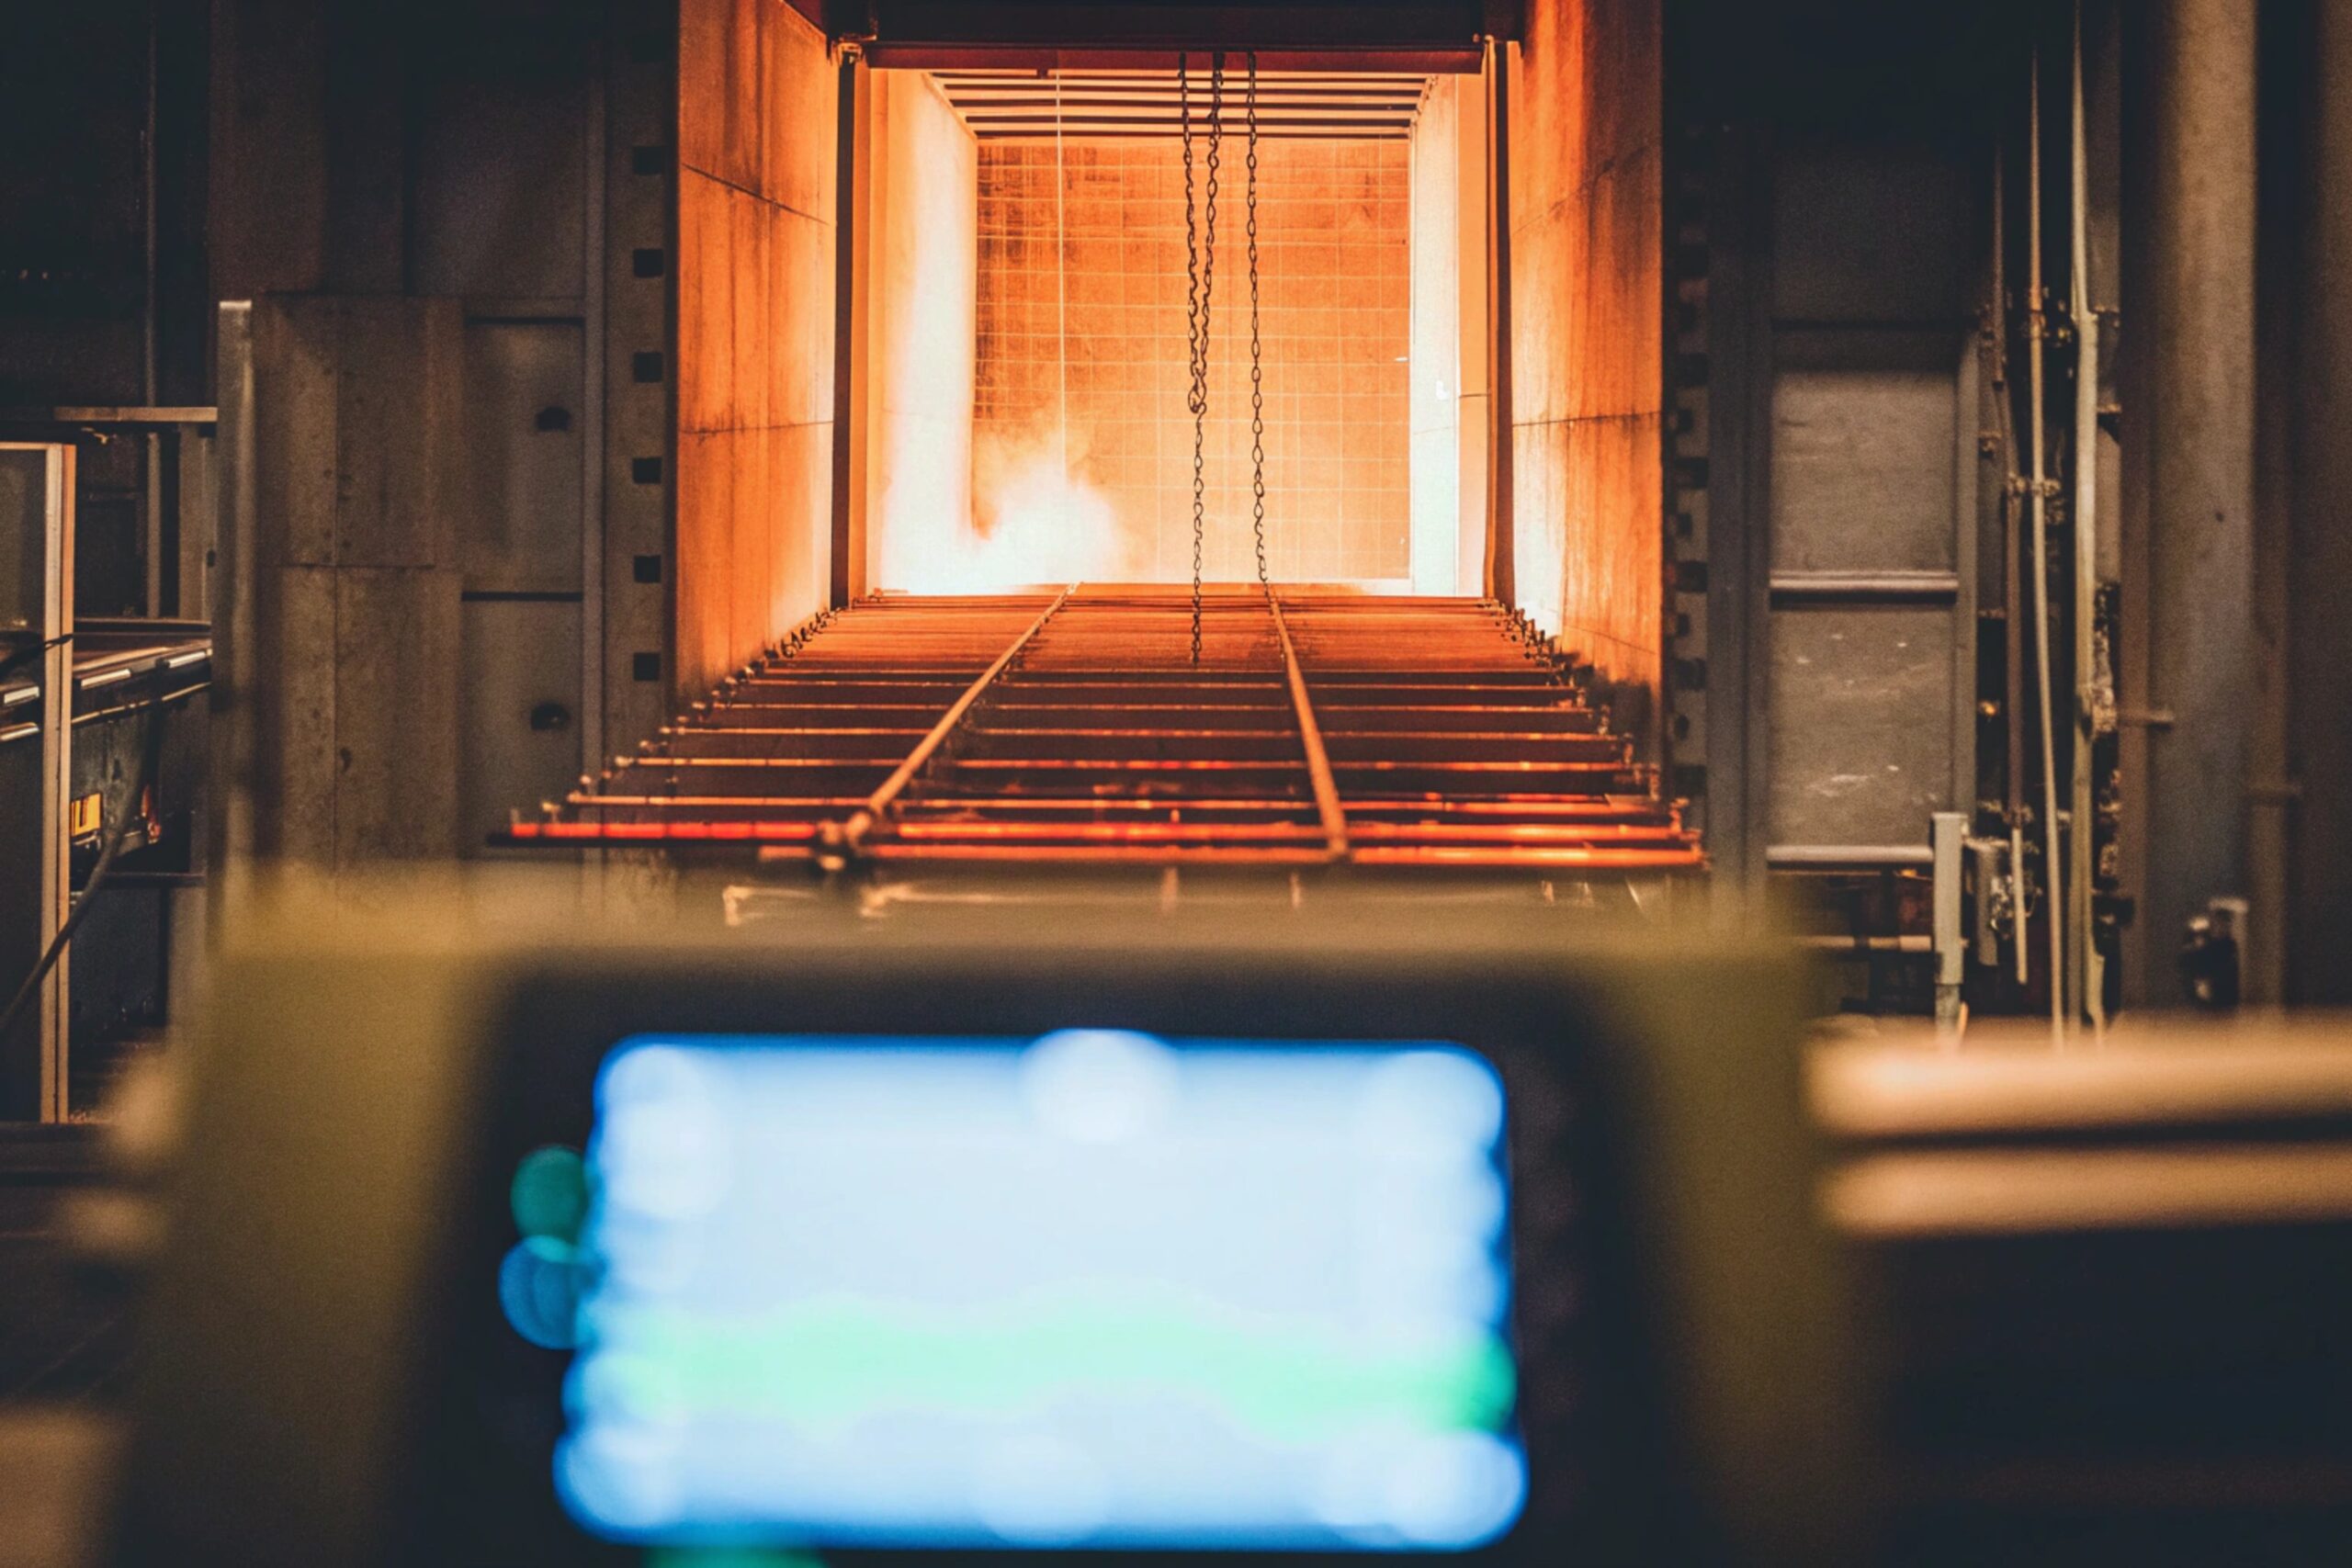
Heat treatment curves 7 offer critical insights into the processing that affects track shoe quality. These graphs illustrate the time and temperature stages the materials undergo.
The heat treatment curve is crucial for verifying track shoe quality. It illustrates the time-temperature cycle necessary to attain desired mechanical properties. Detailed curves ensure the track shoes have undergone proper quenching and tempering for optimal performance.
Understanding the heat treatment curve, which outlines the stages of temperature and time the steel undergoes during processing, is essential for quality assurance. These curves provide vital data on whether correct tempering or quenching cycles were used. Each curve relates to specific material property enhancements, such as increasing toughness or reducing brittleness. For example, maintaining precise temperature intervals and durations can make or break the track shoe's ability to resist impact and wear. Deviations from prescribed curves often lead to issues like cracking or uneven hardness distribution, affecting reliability during intense use.
| Material Type | Temperature (°C) | Time (hours) | Cooling Rate (°C/min) |
|---|---|---|---|
| High Manganese Steel | 1080 | 2.5 | Quick, 60 - 70 |
| Nickel-Chromium Alloy | 980 – 900 | 8 – 1.5 | Slow, 4 – 6 |
| Specialized Dental Steel | 880 – 850 | 1.5 – 2.5 | Controlled |
Are Advanced QC Checks Standard or Extra?
The availability of advanced QC checks varies by supplier. Some provide detailed QC data as standard practice 8, while others may require extra requests and fees.
Advanced QC checks aren't universally standard in the industry. Accessing detailed data like heat treatment curves, hardness maps, and metallographic photos might require extra effort and costs, depending on the supplier's practices.

Advanced QC checks, such as obtaining heat treatment curves or detailed maps, depend heavily on the manufacturer's quality assurance policies 9; they aren't always included in standard packages. While some industry leaders offer them as part of their commitment to quality, others may require these to be specifically requested or incur additional costs. Understanding these practices is key for businesses that demand high reliability in their track shoe assemblies. Suppliers that provide detailed documentation show transparency and dedication to product excellence, which can help prevent supply chain issues related to quality discrepancies in demanding work environments.
Conclusion
Advanced QC data is critical for verifying track shoe quality, and its availability depends on manufacturer transparency and client requests.
Footnotes
1. Detailed explanation of heat treatment curves for metallurgical processes. ↩︎
2. Analysis of hardness distribution maps for material durability. ↩︎
3. Importance of metallographic photos in steel quality assessment. ↩︎
4. Guide to grain structure in quality steel. ↩︎
5. Understanding heat-treatable steel for durability. ↩︎
6. Studying hardness distribution maps for improved wear resistance. ↩︎
7. Role of heat treatment curves in verifying steel quality. ↩︎
8. Overview on standard practices for QC data sharing. ↩︎
9. Insight into quality assurance policies in manufacturing. ↩︎